https://www.downtoearth.org.in/news/economy/it-is-official-unemployment-rate-in-rural-urban-india-highest-in-47-years-64902
The latest Periodic Labour Force Survey (PLFS) states that the unemployment rate (UR) in both rural and urban India is at its highest since 1972.
The unemployment rates among men and women in both rural and urban groups, are also the highest ever. The increase in the UR is more than three times among rural men and more than double among rural women according to the usual status since 2011-12.
In urban areas, the UR among men is more than twice and has increased twice among women since 2011-12. It is to be noted that the UR between 1972 and 2012 was almost static or did not have many differences (See Table 1). Besides, the UR rose sharply among youth of ages between 15-29 years and those who got better education.
The measurement of unemployment is based on the Usual status and Current Weekly status. The Usual Status (ps+ss) approach to measuring unemployment uses a reference period of 365 days i.e. one year preceding the date of the survey of the National Sample Survey Organisation (NSSO) for measuring unemployment.
The Current Weekly Status (CWS) approach to measuring unemployment uses seven days preceding the date of survey as the reference period. A person is considered to be employed if he or she pursues any one or more gainful activities for at least one hour on any day of the reference week.
The Union Ministry of Statistics and Programme Implementation had constituted PLFS under the chairmanship of Amitabh Kundu. The data was collected by NSSO from July 2017 to June 2018. The survey was spread over 12,773 first-stage sampling units (7,014 villages and 5,759 urban blocks) covering 1,02,113 households (56,108 in rural areas and 46,005 in urban areas) and enumerating 4,33,339 persons (2,46,809 in rural areas and 1,86,530 in urban areas).
The unemployment rates in urban areas are higher than those in rural areas. In rural areas, the UR is 5.3 per cent, whereas in urban areas, the UR is 7.8 per cent according to the usual status. The overall unemployment rate is 6.1 per cent in India according to the usual status. According to CWS, the rural employment rate is 8.5 per cent whereas the urban rate is 9.6 per cent. The overall unemployment rate is 8.9 per cent.
In urban areas, the unemployment rates for females are higher than those for males.
 Table 1: Unemployment rate (in per cent) according to the usual status and current weekly status from 1972-73 to 2017-18
 Table 2: Unemployment rate (in per cent) among youth (15 to 29 years) in usual status during 2004-05, 2009-10, 2011-12 and 2017-18
The unemployment rate among youth between 15 and 29 years has risen sharply since 2011-12. Among rural males and females, the UR is almost three times since 2011-12, whereas among urban males and females, this rate is more than double.
The UR has also sharply increased among those who are more educated. Since 2011-12, the UR among rural males has increased by almost three times, from 1.7 per cent to 5.7 per cent. Those who have higher degree of education and those who are completely not-literate have witnessed almost the same level of unemployment.
Interestingly, unemployment among rural not-literate females has reduced and among urban females, the number of those who are literate up to primary-level jobs, is the same as 2011-12. (
See table below)
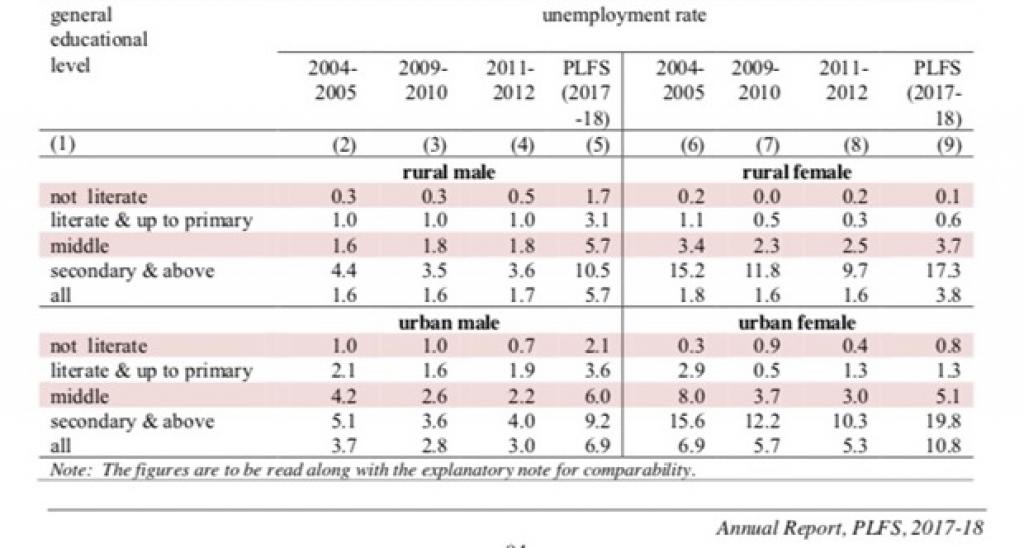 Table 3: Unemployment rates (in per cent) according to usual status for the persons of age 15 years and above with different educational attainments during 2004-05, 2009-10, 2011-12 and 2017-18
Among social groups, the highest UR is among the ‘General’ or ‘Others’ category — 6.7 per cent. This groups is followed by Schedule Castes (6.3 per cent), Other Backward Classes (6 per cent) and Scheduled Tribes (4.3 per cent).
Among religious groups, Christians have the highest UR in both urban and rural areas. In rural areas, Christians have a UR of 7.4 per cent, Muslims have a UR of 6.5 per cent, Sikhs 6.3 per cent and Hindus 5.2 per cent.
In urban areas, Christians have a UR of 11 per cent, Sikhs 9.1 per cent, followed by Muslims 8.5 per cent and Hindus 7.6 per cent.